
Attribution tied to revenue, not to the platform's report.
- Attribution model
- Revenue dashboard
- Creative analytics
- Incrementality tests
- MMM-lite
- Weekly read
One view of what every channel, campaign and creative actually earned. Built by agents on your data, reconciled with finance, and read every week by an analyst who explains it plainly.









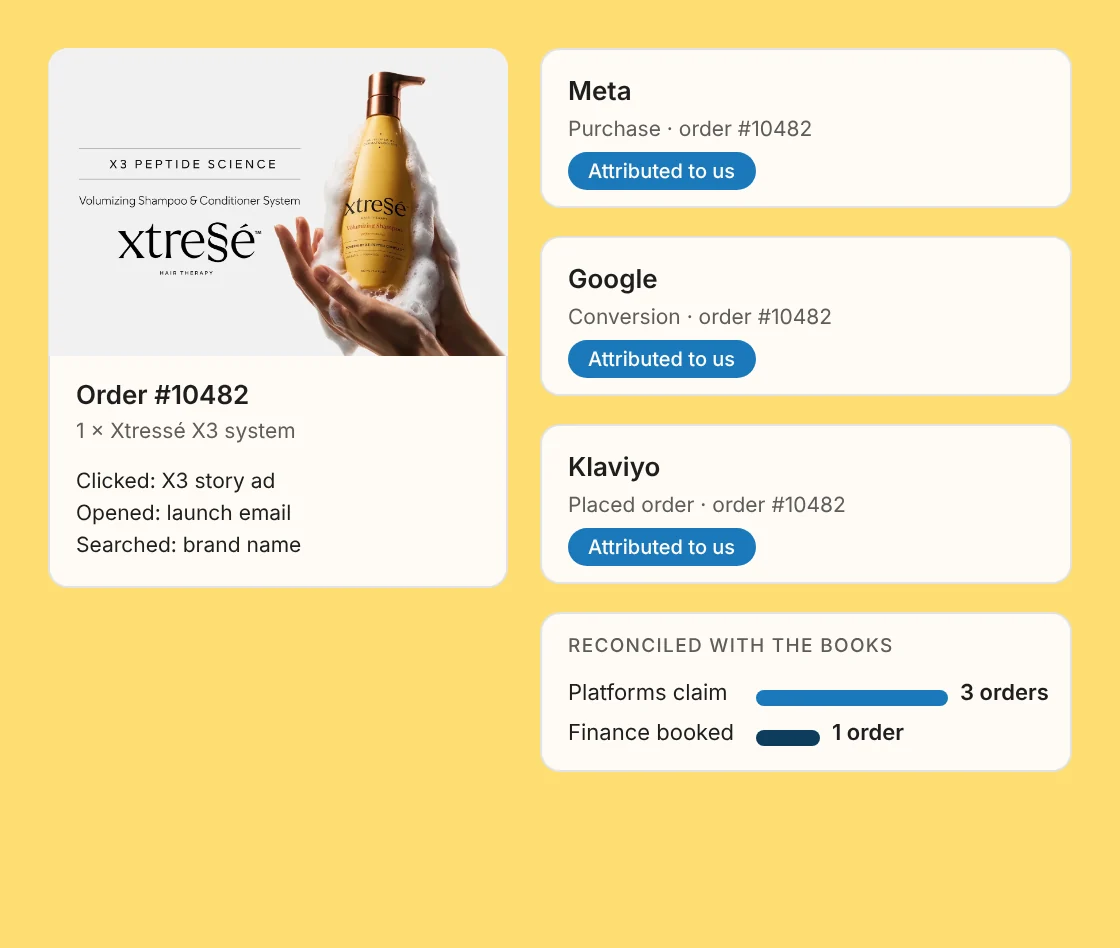
Why the numbers disagree
Every platform claims the same sale.
Meta says it drove the order. Google says it did. Klaviyo says it did. Add them up and you sold three times what finance booked.
Branday builds one view. Platform data reconciled with your store and your books, incrementality tests where they matter, and creative-level reads so you know which ad, not just which channel, earned the revenue.
By the numbers
Results you can point to.
$25M+
in revenue reconciled and attributed
— Branday delivery data, 2025
4.8/5
average approval rating
— Client approval surveys, 2025
2 wks
to the first reconciled dashboard
— Across Branday projects, 2024 to 2025
What we offer
Everything you need to trust the number.









Channel-tailored
Answers for everyone who asks.
- CEOs and boardsOne number that matches the books
- Heads of growthWhere the next dollar earns most
- FinanceAttribution they can reconcile and audit
- Creative teamsWhich work actually sold
- Media and agenciesA shared scoreboard, not a platform report
- Retail and marketplaceSell-through alongside DTC in one view
Runs on Branday OS
Analytics that make every other service smarter.
Results live in Branday OS next to the work that produced them. The agents that write the next ad, page or plan read from the same numbers, and the analyst keeps them honest.
- Context
01 Connect
Platforms, store, CRM and finance. The OS adds the campaigns and creative it already holds.
- Agent Hub · Strategy
02 Strategy agent
Fits the attribution model and flags where a test is worth running.
- Agent Hub · Content
03 Content agent
Builds the dashboards and writes the weekly read in plain language.
- Watchman
04 Analyst
Reconciles with finance, runs the tests and tells you what to do on Monday.
How we work
An analytics team that explains as well as it measures.
- 01
Data audit in week one
Sources, tracking and gaps, with a reconciled dashboard by the end of the week.
- 02
Agree the number
One definition of revenue and CAC, signed off by growth and finance.
- 03
Agents plus an analyst
The agents build and update. A named analyst reads, tests and explains.
- 04
Test what matters
Incrementality where the budget justifies it, modelled everywhere else.
- 05
Weekly read, monthly reallocation
What moved, why, and where the next dollar goes.
Questions
Frequently asked questions.
What is included in revenue analytics?
An attribution model, a reconciled revenue dashboard, creative analytics, incrementality tests, a light mix model and a weekly read with an analyst. Setup is included.
Do we need a data warehouse?
No. We can work from your warehouse if you have one, or stand up a light one for you.
How fast is the first dashboard?
A reconciled dashboard typically lands in the first week, refined over the first month.
Does it feed the creative and media work?
Yes. The agents that produce ads, pages and plans in Branday OS read from these numbers.
Which data sources do you connect?
Ad platforms, your store or CRM, email and SMS tools, marketplaces, retail sell-through and your finance system. If it has an export or an API, it connects.
How do you handle privacy and consent?
First-party data stays in your accounts and your warehouse. Modelling works on aggregates where tracking is limited.
Is this a replacement for our BI team?
No. It gives them a marketing revenue layer they can trust, and an analyst to work with.
How is it priced?
By subscription. See the pricing page for the current plans.
Make sparks happen
Start with a data audit. One number by the end of the week.